관심종목-SOXL
SOXL, A Better Near-Gain Prospect Than The S&P 500: Market-Makers
Jan. 19, 2021 9:36 AM ETDirexion Daily Semiconductor 3x Bull Shares ETF (SOXL)15 Comments12 Likes
15.11K Followers
Bio
Follow
Summary
- Who says? By what measures? By Market-Makers (MMs), based on their hedges of short positions required when filling “institutional” orders in big-volume block trades.
- Compared to what alternatives? Compared to the odds-on risk~reward prospects for the next three-month price changes in market-index ETFs with credible prior forecasts like today’s.
- Compared to other market index-tracking ETFs equally-leveraged in their construction, SOXL offers attractive upside price range forecasts while pointing out care needing attention in evaluating history.
Investment Thesis
Big-volume “block” stock trades require negotiated off-exchange-floor “facilitations” of market liquidity by market-making firms to promptly balance supply-demand disparities as market anticipations evolve. The resulting MM capital risks are hedged by deals in derivative securities to offset price changes in the underlying stock until those temporary positions can be unwound.
The derivatives transactions reveal the coming price-range expectations of the MM community. History of prior hedges and subsequent market price changes provide odds for potential price-change gains this time around.
Current market prices compared to expected price extremes offer significant upside price change prospects for Direxion Daily Semiconductor Bull 3x ETF shares (SOXL) compared to other current market-index ETFs.
ETF Description
“Direxion Semiconductor Bull 3X SOXL – Up 19.4%
The global semiconductor industry is in a sweet spot. Per the latest report from the World Semiconductor Trade Statistics (WSTS), the global semiconductor market is expected to increase 5.1% year over year in 2020 driven by memory and sensors. For 2021, growth is projected at 8.4% based on the expected growth of memory and optoelectronics. This piece of information charged up the semiconductor stocks last week.”
Source: ZACKS

Source: Yahoo Finance
Indexes of Forecast Price Ranges
The advantage of Market-maker forecasts is that by indicating the extremes within which near-term coming prices might occur we have a clearly-defined balance between stock price risk and return which is absent from most vacuous investment forecasts.
Example: A forecast price range from $75 to $120 with a current price of $88 offers $32 upside and $13 downside. While perhaps seemingly trivial, the upside is a potential gain of +36%, and the downside may be -15%. Careful measurement of the up and down range proportions finds 26% to the downside and 74% to the upper portion, an almost 3-to-one gain advantage. We use the 26 downside as the measure of the Range Index [RI]. These are the March 2010 proportions of the market-making community’s price range forecast for SOXL stock.
Comparing Investment Alternatives Prospects
Each market day we examine the MMs’ Range Index prospects for over 4,500 stocks and ETFs. Some two thousand have no credibility and are discarded. The remainder are categorized historically by their current RIs to determine what has happened to them in prior market experiences like those of today. Figure 1 pits SOXL against the S&P 500 Index Trust ETF (SPY) and some of its growth, value, and income variants, and other market index ETFs.
Figure 1

(Used with permission)
The tradeoffs here are between near-term upside price gains (green horizontal scale) seen worth protecting against by Market-makers with short positions in each of the ETFs, and the prior actual price drawdowns experienced during holdings of those ETFs (red vertical scale). Both scales are of percent change from zero to 25%. Desirable locations are down and to the right.
The intersection of those coordinates by the numbered positions are identified by the stock symbols in the blue field to the right. The ‘market-average” notion SPDR S&P 500 Index ETF (SPY) at location [3] provides a sense of trade-off norms. Its “Income” version, SPYD has insufficient history to provide the credible comparisons of SPY Growth and Value variants at locations [6] and [7]. SOXL at [9] is our principal focus.
The dotted diagonal line marks the points of equal upside price change forecasts derived from Market-Maker [MM] hedging actions, and the actual worst-case price drawdowns from positions that could have been taken following prior MM forecasts like today’s.
This map is a good starting point, but it can only cover some of the investment characteristics that often should influence an investor’s choice of where to put his/her capital to work.
Figure 2 presents the MMs’ price range forecasts for our principal-interest investment candidate and their competitor alternatives, along with the histories of outcomes from the prior forecasts having the same proportions of upside-to-downside prospects as today’s.
Principal questions for all alternatives are “how likely are these outcomes to happen,” and “can their impact be improved?”
Figure 2 presents the MMs’ price range forecasts [B] to [C] for the alternative investment candidates in Figure 1, along with the outcomes [I] from their prior past 5 years of daily forecasts with the same proportions [G] of today’s up-to-down Range Index prospects.
Figure 2

Source: Author
Contributing to that comparison are the demonstrated odds of a profit-successful forecast in column [H], and its complement of 100 – H, or loss frequency. Size of net gain attained [I] and size of worst loss experience [F], are combined so that, when appropriately weighted in [O] and [P], they produce the Net of [Q]. Respecting the power of compounding, [Q] converted into basis points per day [J] of capital commitment at [R] presents a highly comparable figure of merit (fom) for investing preferences where the dominant objective is to build easily liquidated capital to meet emergency, retirement or other planned needs.
The figure of merit (fom) [R] for each row provides an additional measure of attraction, emphasizing the capital gain potential for SOXL. Since the [H] odds on wins vs. losses and the [J] holding periods impact [R], the samples from which past outcomes are drawn need careful scrutiny.
The data in the [L] column for SPYV is in pink to alert observers of potential comparison problems from an inadequate sized sample. Other data items of concern include [G] RIs from current prices well above their ETFs’ forecast price range midpoint of 50.
Recent MM hedging-implied price-range forecasts
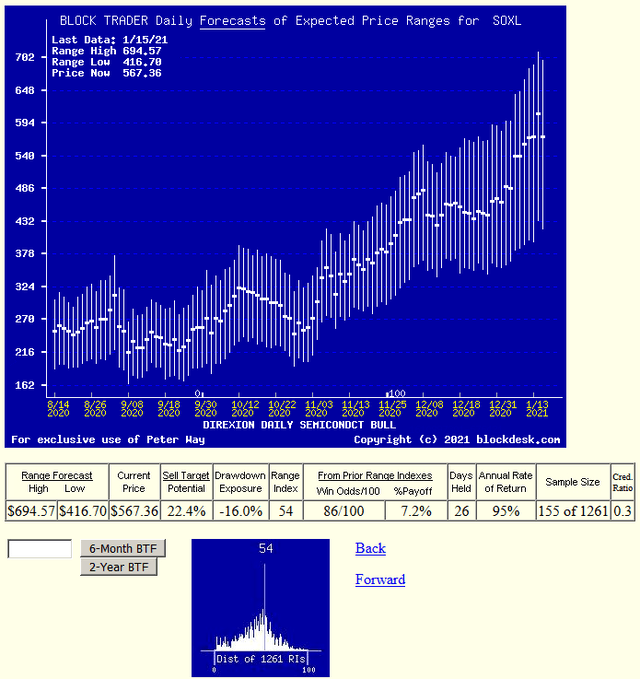
Figure 3 is NOT a conventional "technical analysis chart". Instead of portraying past price history, it pictures the future price limitations expected by the market-making community as they seek and obtain protection from coming changes from the market prices at dates indicated.
Figure 3
(used with permission)
Figure 3 contains at its bottom a distribution of the last 5 years’ Range Indexes. At 54 the current forecast range has a touch more downside than upside, but is at the most frequent point and has 155 priors. Of that sample 86% were closed out at a profit score, although the sample is only 1/8th of the 5 years’ experiences.
Further, the average realized gain scores were only +7.2%, well below the present target of +22.4%. Targets of those prior scores likely were in less uncertain times than at the present. Still, the worst-case price drawdowns of -16% must have taken a large bite out of the targets to produce a net gain realization of only 7.2%.
But the offset is in their short 5+ week average holding periods (26 market days) which generated Compound Annual Growth Rates of +95%. Duplication of prior experiences can be very rewarding, more than the alternatives with which they are being compared.
Investing, like the rest of life, is laden with trade-offs. Each investor has preferences and personally-set standards of acceptability. Each investment security candidate for the portfolio has its line-up of advantages and disadvantages to be presented to the investment committee. With an individual investor’s committee of one, the decisions may come more easily than when there are other minds to convince.
Conclusion
For the investor intent on wealth-building her/his portfolio, from this set of appraised prospects, Direxion Daily Semiconductor Bull 3x ETF (SOXL) appears to be the dominant choice in a portfolio managed under the TERMD discipline. Leveraged ETFs of its type are never “buy&hold” commitments in any sensible investing program. Its appeal is far above the average over-3300 securities forecast population of other stocks, and is even above the S&P 500 Index ETF (SPY) prospects at its present appraisal.
Still, these are calculations based on past outcomes from then-future expectations of other knowledgeable investors, made under likely somewhat different circumstances. No guarantees, just best estimates.
Disclosure: I/we have no positions in any stocks mentioned, but may initiate a long position in SOXL over the next 72 hours. I wrote this article myself, and it expresses my own opinions. I am not receiving compensation for it (other than from Seeking Alpha). I have no business relationship with any company whose stock is mentioned in this article.
Additional disclosure: Peter Way and generations of the Way Family are long-term providers of perspective information, earlier helping professional investors and now individual investors, discriminate between wealth-building opportunities in individual stocks and ETFs. We do not manage money for others outside of the family but do provide pro bono consulting for a limited number of not-for-profit organizations.
s